I designed a dashboard that helps teams spot a change in a metric, see when it happened and decide which posts, formats or audience segments to look at next
analytics
web service
data visualization
concept
About the project
Scope Analytics is an analytics concept for content, marketing and product teams
Each team comes to the data with a different question. Content teams compare posts, marketing teams track engagement trends, and product teams look at how activity and retention vary by audience segment
Role
UX/UI Designer
Timeline
2 weeks
Year
2026
Project type
Concept
Focus
Dashboard structure, data visualization, light and dark themes
The challenge
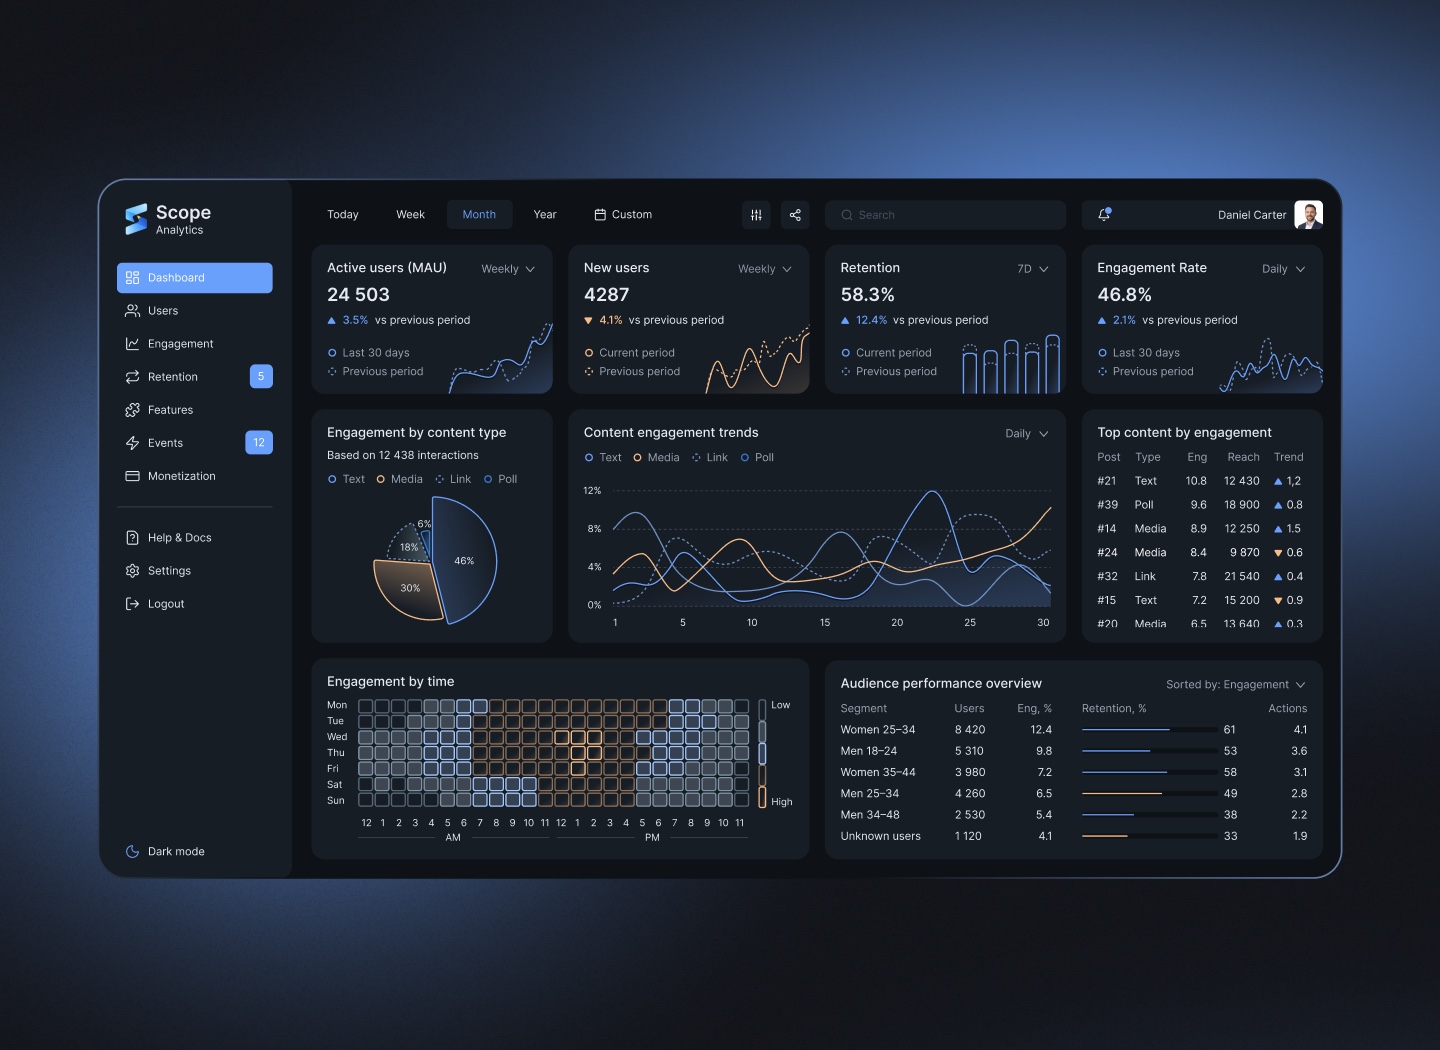
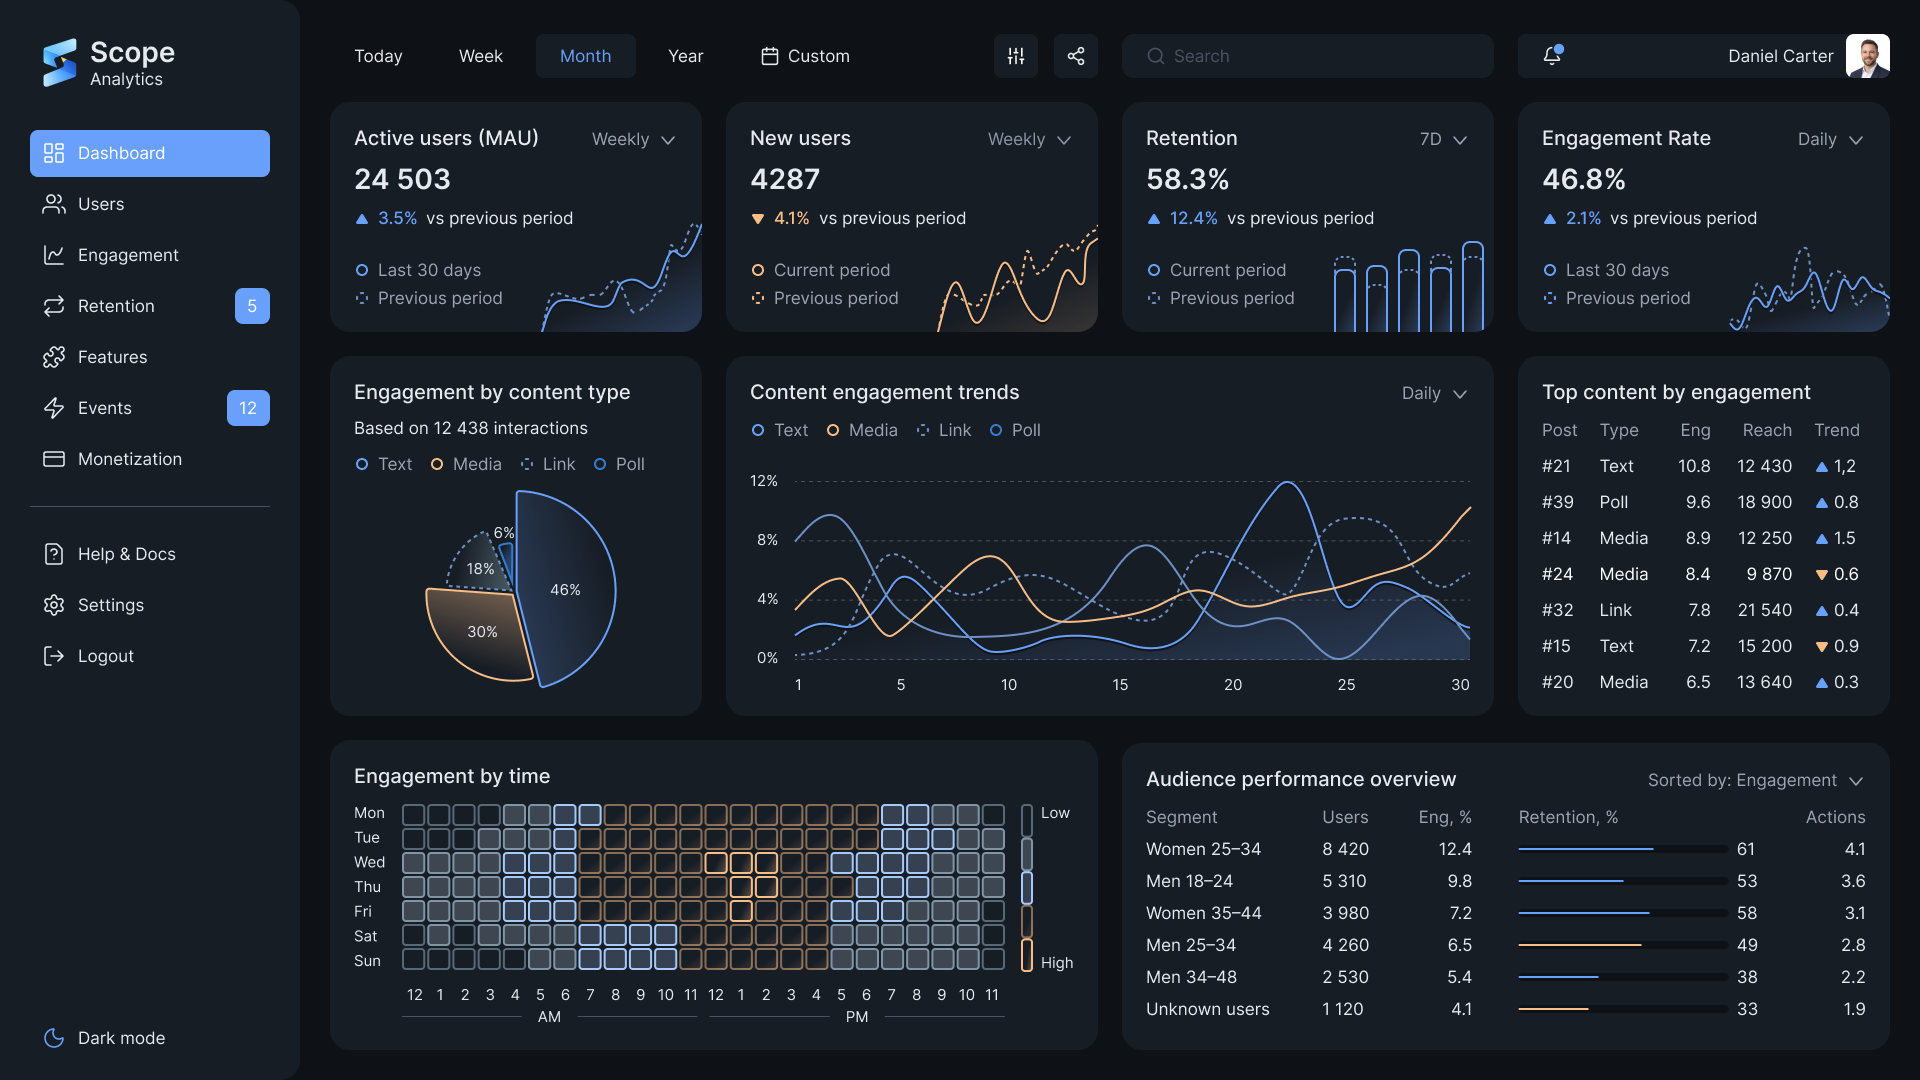
The screen needed to bring together period metrics, daily trends, post rankings and audience data. I arranged them in the order a team might investigate a change: spot the signal, locate it on the chart and decide what to examine more closely
My design decisions for Scope Analytics
Put key metrics in the top row
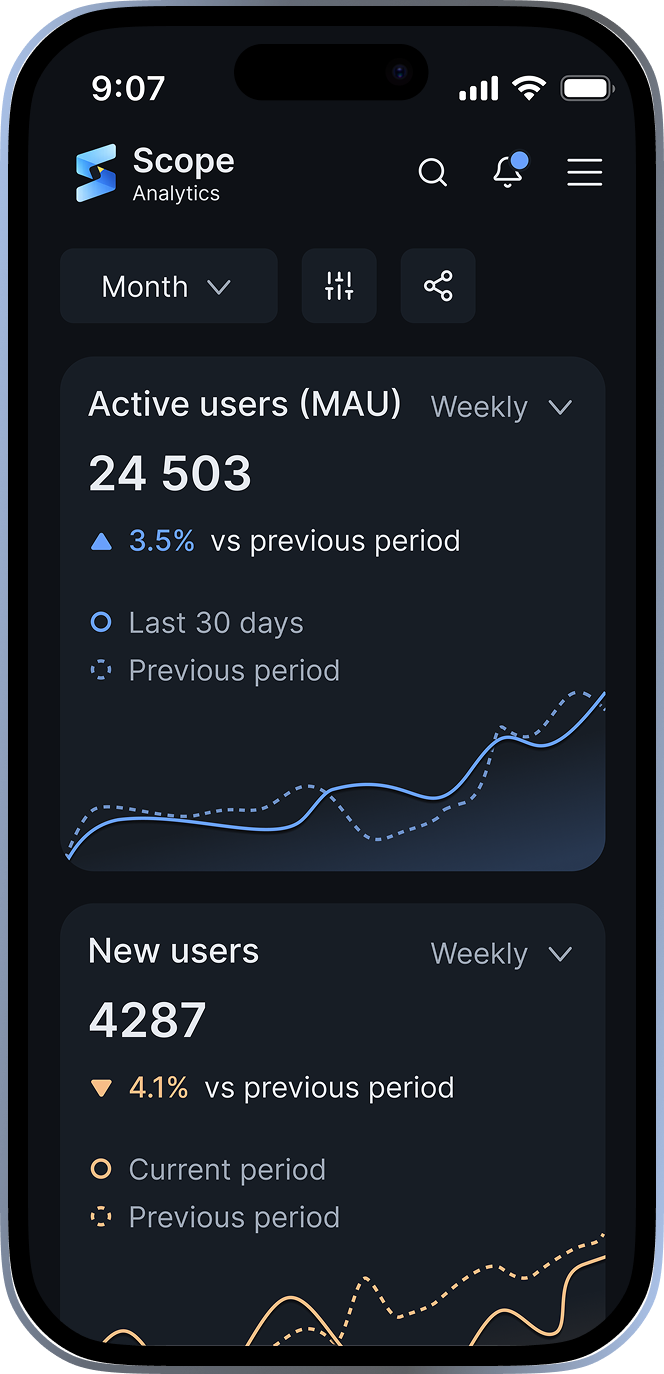
Active users, new users, retention and engagement sit at the top of the dashboard. Each card shows how the current figure compares with the previous period. For example, a team can quickly see that the active audience grew while new user numbers fell
Connected trends with formats and posts
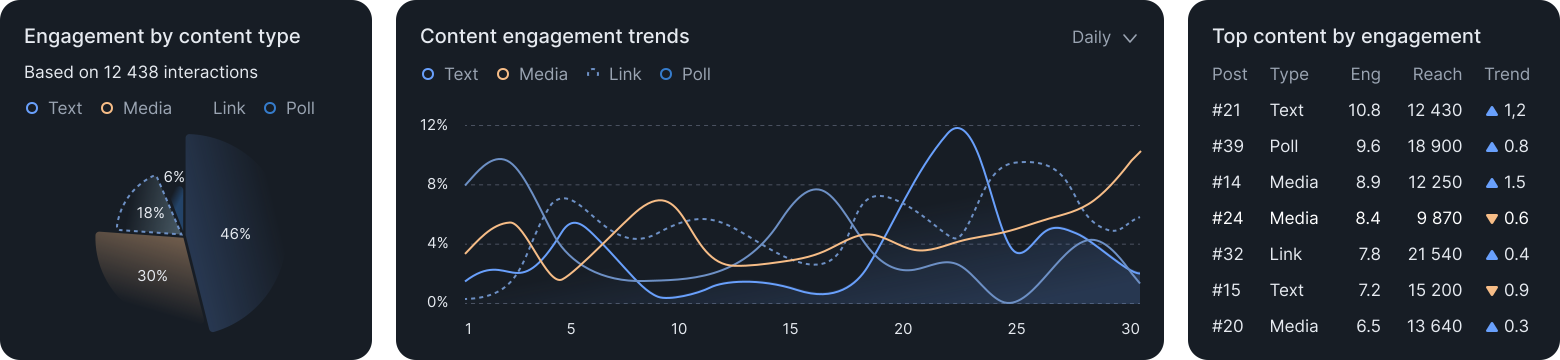
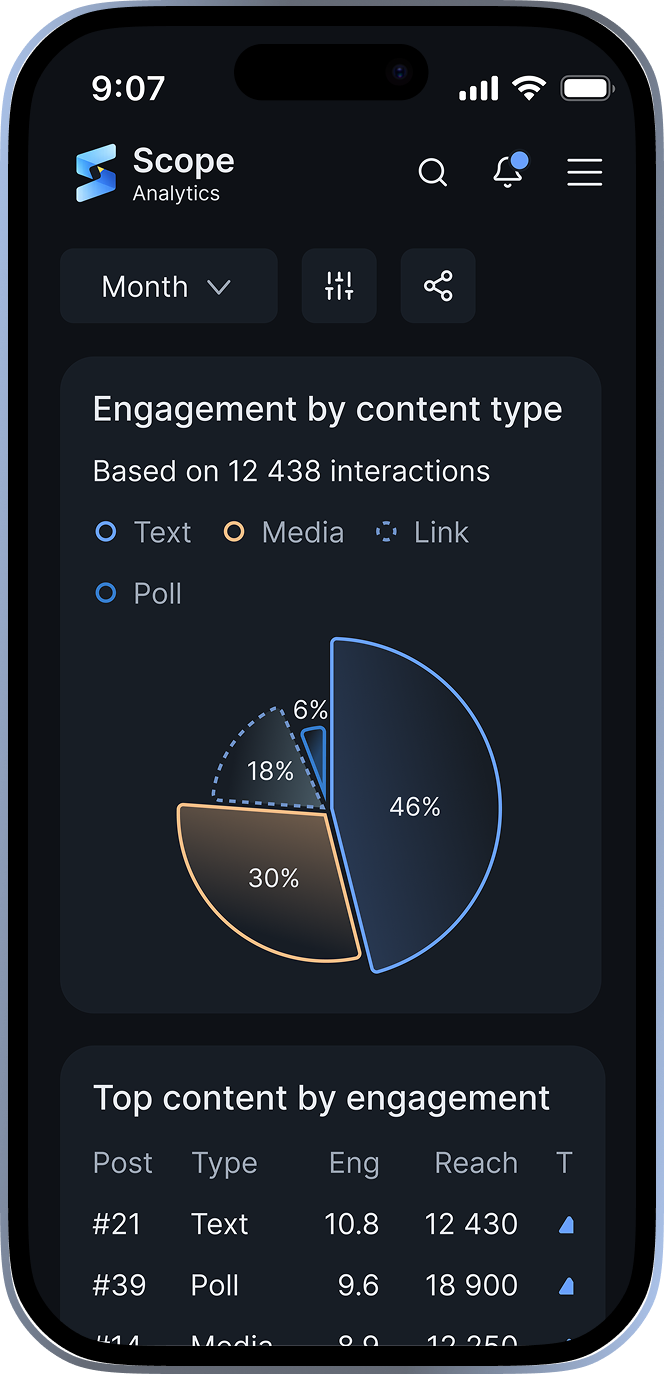
I placed engagement by format and a post ranking next to the daily chart. The chart shows when a change occurred, the format breakdown supports comparisons over the period, and the ranking helps identify posts to examine. Exact values appear on hover, keeping the chart clear
Separated two questions about the audience
The heatmap shows when the audience is most active, and the segment table shows which groups have higher engagement or retention. Together, they help teams choose a publishing time or compare how groups behave
Themes and interaction states
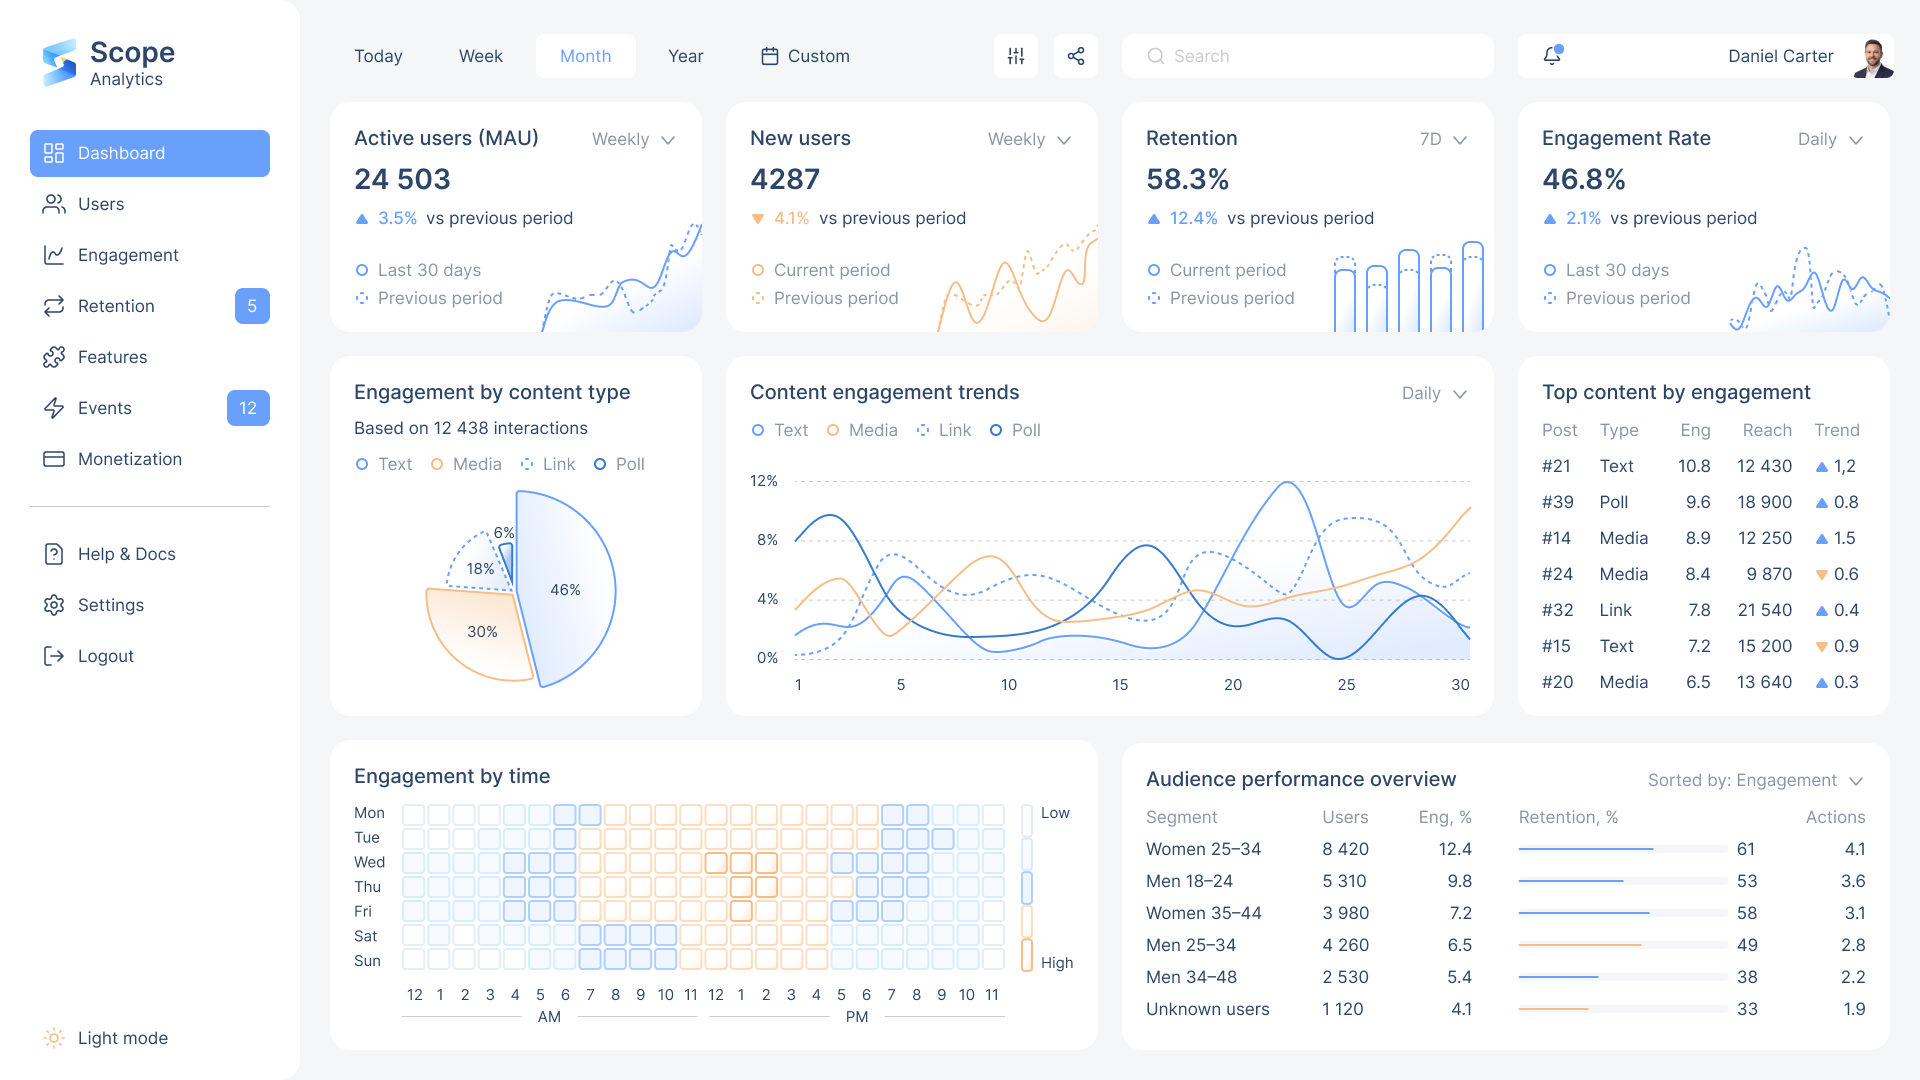
Both themes preserve the layout, series colors and the distinction between solid and dashed lines
Readability across devices
I designed a structure that is easy to scan on both a large display and a phone. On desktop, teams can compare panels side by side. On a narrow screen, the same hierarchy carries over into a vertical layout: key metrics come first, followed by charts and tables. The mockups illustrate that approach with metrics and content analytics
What I designed and how I would test it
I designed the overview in light and dark modes, arranged the data in three levels and demonstrated how users can move from a headline metric to an exact chart value
I would give users a concrete task: find a day when engagement rose for text posts, read out the value and choose which posts to look at next. I would also check how easy the same task is on a narrow screen and whether the lines and tooltips are legible in both themes